Exploring Signatures and Logs with Suricata
Activity Overview
In this lab activity, I explored how Suricata, an open-source intrusion detection system (IDS) and intrusion prevention system (IPS), utilizes rules to monitor network traffic. Using the Bash shell, I examined rule components, triggered a rule, and reviewed the resulting alerts and logs.
This lab included multiple tasks:
- Examined a Rule in Suricata: Reviewed the structure and purpose of a Suricata rule.
- Triggered a Rule and Reviewed Alert Logs: Tested a rule by triggering it and analyzed the generated alert logs.
- Examined eve.json Outputs: Inspected Suricata’s eve.json output to understand how events are recorded and logged.
Scenario
As a security analyst tasked with monitoring network traffic, I used Suricata to configure and trigger alerts on specific network events. I explored Suricata’s custom rules and tested them against sample network data contained in sample.pcap and custom.rules files. Suricata generated alerts based on these rules, which I reviewed in the fast.log and eve.json files located in /var/log/suricata.
- sample.pcap: A packet capture file containing network traffic data used for testing.
- custom.rules: A file where I added and tested new custom rules.
- fast.log: A quick log for alert checks, adding entries whenever rule conditions were met. Though deprecated, it’s useful for immediate rule testing.
- eve.json: The main JSON log that provides detailed alerts and telemetry events for deeper analysis.
Task 1: Examining a Custom Rule in Suricata
In this task, I reviewed a custom rule in Suricata to understand its composition, which consists of three main components: action, header, and rule options.
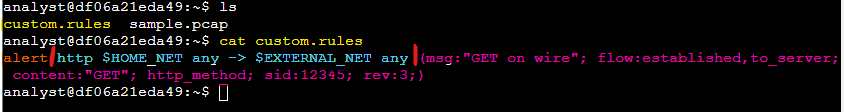
- Action: The action (
alert) determines what Suricata does when conditions are met. Here,alertinstructs Suricata to monitor for specified traffic and generate an alert if detected. Alternative actions likedrop,pass, andrejectare used to block or pass traffic, depending on network needs. - Header: The header defines network attributes such as protocol, source and destination IPs, ports, and traffic direction. In this example, the protocol is HTTP, with traffic originating from
$HOME_NETand directed to$EXTERNAL_NET, indicating outgoing HTTP traffic from the local network to external sites. - Rule Options: This section includes specific conditions for triggering an alert, such as searching for
GETas the HTTP method, setting a unique signature ID (sid), and specifying the revision version (rev). The message (msg) displays alert text ("GET on wire") to indicate why the alert was triggered.
To summarize, this rule generates an alert when Suricata detects HTTP packets containing the GET method from the home network to an external network. This exercise deepened my understanding of how custom Suricata rules are structured and applied in network monitoring.
Task 2: Triggering a Custom Rule in Suricata
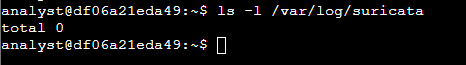
Next, I ran Suricata with a custom rule to observe the generated alerts. First, I verified that the /var/log/suricata directory was empty before executing the rule.
Then, I used the following command to process a sample packet capture (sample.pcap) using the rules in custom.rules:
sudo suricata -r sample.pcap -S custom.rules -k none
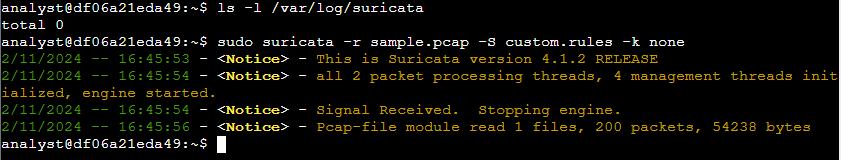
Command Breakdown:
-r sample.pcap: Specifies the input file to simulate network traffic.-S custom.rules: Instructs Suricata to use the rules defined in custom.rules.-k none: Disables checksum checks, as they are unnecessary for the sample packet data.
After running Suricata, four files appeared in /var/log/suricata, including fast.log and eve.json, which contain alerts triggered by the custom rule.
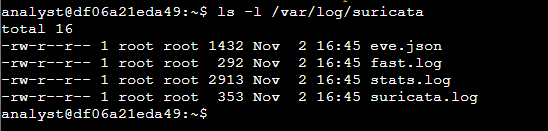
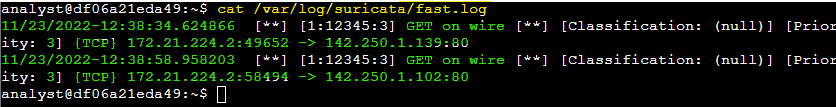
I examined the fast.log file using cat, which displayed alerts in real-time, with each entry showing the rule message ("GET on wire"), traffic classification, priority, and details about the source and destination. This exercise provided hands-on experience in setting up custom rules in Suricata, monitoring traffic, and interpreting alert logs.
Task 3: Examining eve.json Output
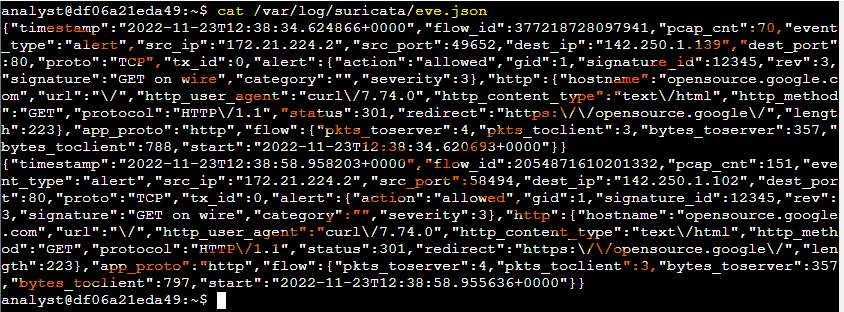
Additionally, I analyzed Suricata’s main log file, eve.json, which stores detailed event data in JSON format. Located in /var/log/suricata/, this file includes extensive information beyond what’s available in fast.log, making it more valuable for in-depth analysis.
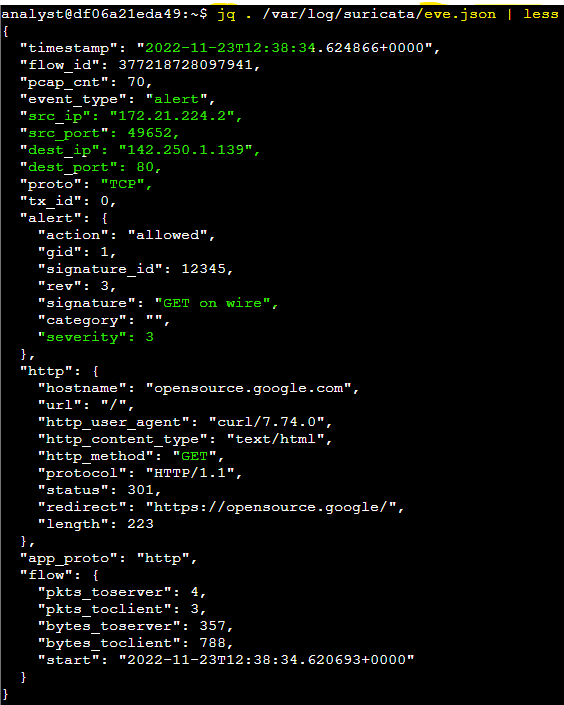
To improve readability, I used the jq command, which formatted the JSON output for easier inspection. I examined the severity level, alert signature, and destination IP, confirming that the first alert’s severity was 3, the alert signature was "GET on wire," and the destination IP address for the first event was 142.250.1.139.
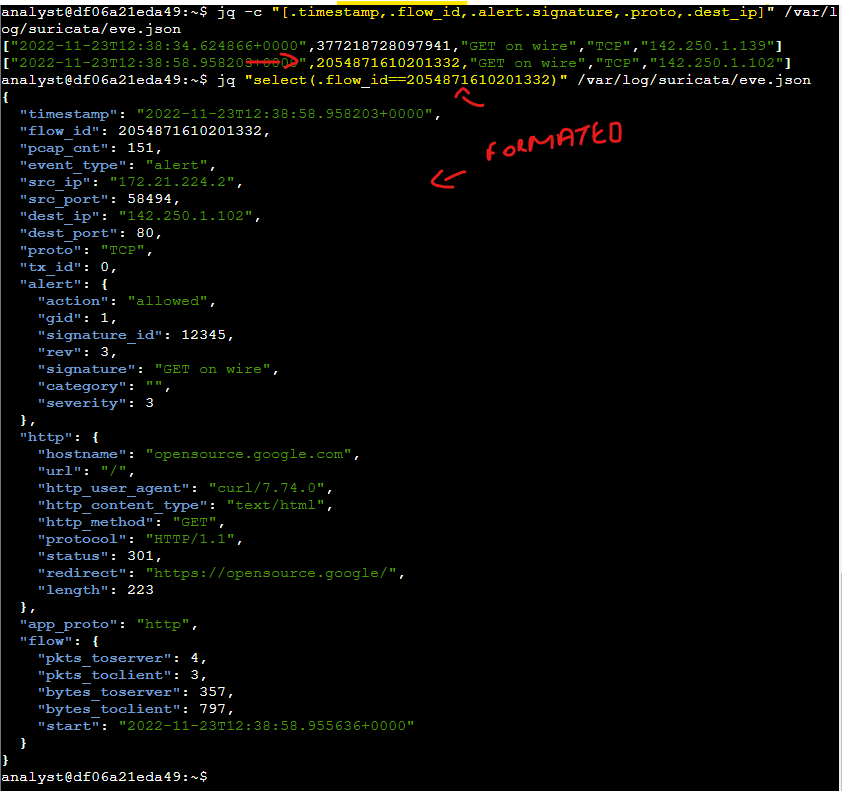
Finally, I used jq to filter specific event data, such as timestamps, flow IDs, alert signatures, protocols, and destination IPs, and explored how flow IDs track network sessions within the log.
Note:
A network flow refers to a sequence of packets between a source and destination that share common characteristics such as IP addresses, protocols, and more. In cybersecurity, network traffic flows help analysts understand the behavior of network traffic to identify and analyze threats. Suricata assigns a unique flow_id to each network flow, making it a useful field for correlating network traffic that belongs to the same flows.
Conclusion
Through this lab, I gained hands-on experience with Suricata’s custom rules, packet capture monitoring, and analyzing Suricata outputs in fast.log and eve.json. This activity sharpened my skills in creating and testing intrusion detection rules, monitoring network traffic, and using JSON parsing for security analysis—key competencies for a security analyst.